I wrote this text originally for my architecture students, as they were struggling quite a lot with the design development. Seemingly no one told them how to go from the first concepts to a finished plan. It was also a good opportunity to revise my own knowledge and views on the subject.
There are five types processes of project design: linear, divisions, centralized, cycle, and investigative (here is a brief explanation for all of them). Each of them has its advantages, but I strongly recommend to start with the variant 2: divisions, as it is in my experience the most robust system. I have developed a variation of the system, which bases mostly on my notes from the lectures of dr. Carl Steinitz and dr. Janez Marusic.
Design process can be divided into three phases: Analysis, Vision, and Design. Analysis phase is the imput – here are organised all entry data: site analysis, usage, spatial limitations, and zoning. Key objective in this phase is to define the key problems of the site (is there an important visual axis, are there any unpleasant surrounding elements, a loud side road, or similar). Vision is the new quality your development is bringing to the site, which is then refined in the concept and development phases. The end result is the site plan with graphical representations.
Here is the whole scheme:

Let´s take a look at each step separately, where I will also present what is done in each phase.
1) Inventarisation
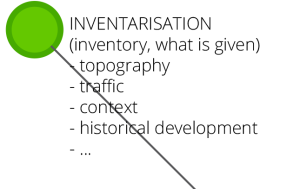
To immediately clear the difference between inventarisation and analysis: the goal of inventarisation is to list and organize all of the information from the site, while the analysis shows personal interpretation of the site qualities. Inventarisation is a graphic catalogue of all existing conditions of the site, exactly as they are. For example, roads around the site are divided according to their size, traffic usage, etc. (and drawn on a map).
Most common subcategories are:
- Traffic: typology of roads (alley, highway,…), typology of traffic (commute, heavy transit traffic, bicycles,…);
- Land usage;
- Access;
- Topography: elevation, slopes, geological features,…;
- Context: typology of surrounding buildings, shadows, land use,…;
- Historical development;
- Exposure to natural elements: insulation, precipitation, temperatures, snow,…;
- Vulnerability to natural disasters: 100 year floods, earthqakes, …;
2) Analysis

In simple words, analysis is a personal interpretation of the site and its surroundings. Analysis does not need to be graphic (even though it usually is). Sometimes a SWAT analysis is enough. The key of the analysis so to define the key problems on the site, and to show your personal position on the site’s current qualities.
Some key bullet points:
- Exposing key visual elements: points, axis, surfaces (Lynch’s analyis);
- Defining current site qualities, weaknesses;
- Giving or taking away the importance of the existing elements (existing buildings, roads, usages…);
- Areas to keep, areas to upgrade, areas to change, areas to remove;
- New openings, new closures;
- Placing the site in a wider context;

3) Programme
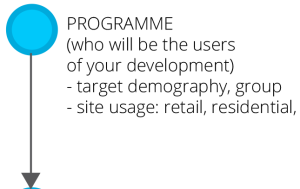
Different types of users demand different typologies of buildings. If, for example, on the site is planned a residential area, it is also very important to determine what type of residents will live there. Usually, the more detailed it is, better it is. Details help, as specific residents demand specific usages; a young family will find important to have bigger, calmer appartments, and the vicinity is a playground, while young students will be satisfied with smaller, darker dwellings, possibly close to bars. Same goes for commercial usage: startups or small companies demand different plot sizes and building typologies than large corporations, retail different than a car mechanic.
Key bullet points:
- defining types and subtypes of usage
- defining spatial demands for each type of use

4) Zoning

When the site usages are defined, it is necessary to organize them in a system. Some usages are not compatible and should be separated, while others can be close to each other. Some even thrive in the vicinity. If we take a simple example: It is usually good to separate kitchen and the sleeping rooms (for the odors), or keep kitchen close to the living room. In city planning is usually good to separate residential areas from industrial zones, and to keep residents close to parks and public transportation.
Some usages are more important and must be placed more to the middle of the site, while others, less important can be placed on the side. In the drawing below is the main stage in the middle of the drawing (of course), while offices can be somewhere on the side.

5) Vision
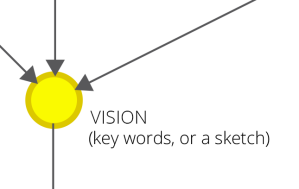
After the analysis we must synthetize all gathered data into a key concept, the main vision for the site. This main unifying idea tries to catch the spirit of the new development, the added value it brings, a new quality to the site. It can also be just a slogan, or someting similar. The main vision solves the main problems of the site and offer some new quality, which is cruicial.

6) Talent
Sometimes it is possible to skip the first four steps and go directly to the vision, ignoring the given situation on the site and start with a brand new development. It is possible, although those plans are rarely better than those which follow a more systematic approach. Analysis is is cruicial in design process, as it helps build a relationship with the site and sometimes it unveils the true and unexpected problems of the site.
7) Concepts
Each vision, can be drawn in different ways. The same idea can be presented in many forms. It can be orthogonal, curved, polymorphic, drawn in circles, or composed of a myriad of forms. The new development can be one megablock, or many smaller city quarters, or a skyscraper. Some typologies fit better to the main idea. The goal is to find which typologies support the main idea the best. In this phase the details are not that important. What is important is to find the rough holding shape, which captures the best the vision. In latter steps is this form refined with all the details.

8) Variants

Each concept can be drawn in different variants. For example, if the concept is a rectangular building, we can draw in many different ways: with sqare as a base, or the 1:2 rectangle, or 1:4 rectangle, and so on. What is important is the reversibility of the process. If variants seem to lead to a dead end, it is possbile to step back and try another concept.

9) Result

The end results of the design process can be divided in three groups: Site plan, picturesque representations (isometries, 3D pictures, sections, views), and the supporting graphics (pictograms, sketches, analysis, …). I will focus just on the later, as the first two are quite self-explanatory. The key purpose of supporting graphics is to show the thought process of the architect and to explain the main idea of the development. They tell why your development is different from others and which new quality it is offering to the site. Sometimes is enough to show just a hand sketch. Other time is enough to show (polished) inventarisation, analysis, and zoning sketches from previous steps (especially those which are relevant and support the main idea).
Architecture ideas are increasingly complex and have to include many aspects: aestethics, structural design, social interactions, energetic and environmental views. Representing all those aspects is perhaps one of the most challenging tasks.
In my experience, it is usually enough if only one of those elements word-class excellent (either the site plan, representations, or suppotrting sketches). Other elements can be top or middle good, and the whole representation will look ok.
Conclusion
Sometimes is possible to jump a few steps and go directly into developing a project. But if you ever get stuck in developing a project, I would consider to simply follow a system. There are many options for that and in the text above I tried to explain one of the possible systems. The steps above usually lead to at least a solid design solution, if not more. The analysis phase helps define the main problem of the development, from which we can extact the vision. The following execution is just trial and error finding the best typology (and other details) for the site.
